Gold Demand in Q2 2026: What Changed Behind the Record Value
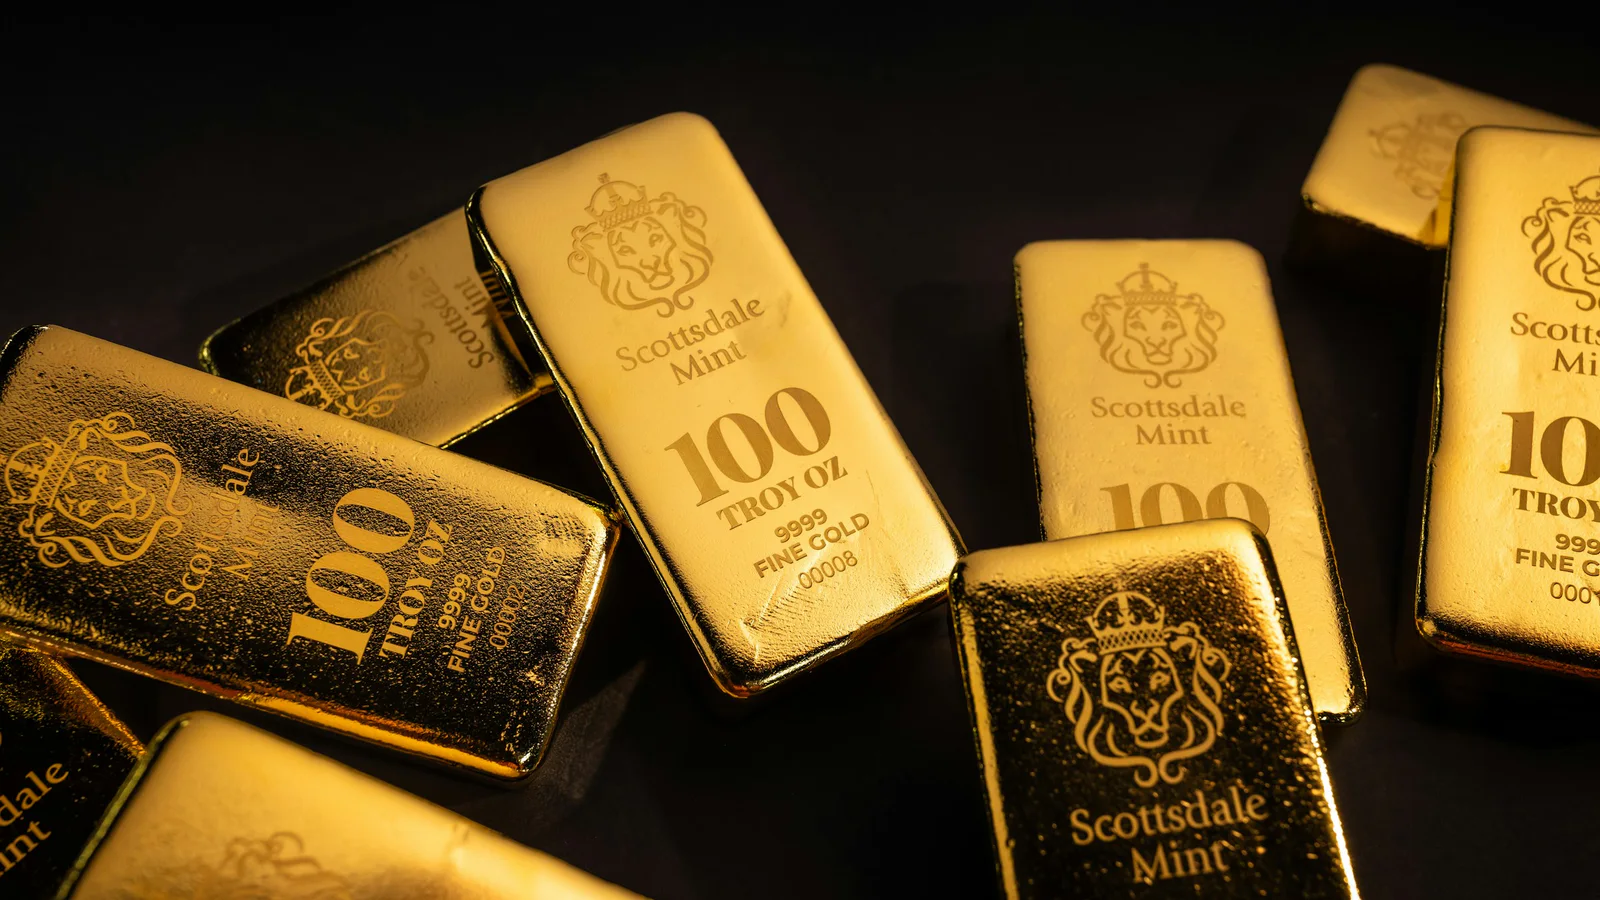
Image: Scottsdale Mint / Unsplash
The headline from the World Gold Council’s 30 July report is easy to misread. Total Q2 gold demand, including over-the-counter activity, was essentially unchanged from a year earlier at 1,269 tonnes. Yet the value of first-half demand reached a record US$380 billion.
Both statements can be true because tonnes and dollars answer different questions. One measures physical volume; the other combines volume with a much higher price.
This article summarizes a limited set of World Gold Council statistics for review and commentary. It is educational, not investment, tax, or trading advice.
The five-part picture
| Q2 2026 measure | Reported result | What it does not prove |
|---|---|---|
| Total demand including OTC | 1,269t, unchanged year over year | That every demand channel was stable |
| First-half demand | 2,522t, up 2% year over year | That volume caused the record dollar value by itself |
| Bar and coin investment | 307t, broadly steady year over year | That retail buying rose in every country |
| Gold ETF flows | 45t of outflows in Q2 | That all investment demand disappeared |
| Central-bank and institutional demand | 289t in Q2 | That future official-sector buying is guaranteed |
The category split matters more than a single “gold demand” slogan.
Price amplified the dollar value
The report gives an average Q2 LBMA PM gold price of US$4,506.29 per ounce, 37% above the Q2 2025 average but 8% below the Q1 2026 record. Against that backdrop, a modest change in tonnes can produce a much larger change in market value.
For owners of physical assets, that distinction is practical. A rising quoted price can lift the estimated value of a holding even while transaction volumes, premiums, liquidity, and buyer behaviour move in different directions.
Investment demand split
Gold-backed ETFs recorded 45 tonnes of outflows in Q2. The World Gold Council associated the selling pressure with weaker prices during the quarter and adjustments to inflation, interest-rate, and US-dollar expectations, particularly in North America.
Bars and coins followed a different path. Their 307 tonnes were approximately steady from a year earlier, though sharply below the unusually strong first quarter. “Investment demand fell” therefore hides two different channels with different owners, custody, liquidity, and transaction costs.
Central banks recovered while jewellery volume weakened
The report recorded 289 tonnes of central-bank and other institutional demand after a revised, weaker first quarter. Jewellery consumption volume fell to 278 tonnes, the lowest quarterly level since the pandemic according to the report, while jewellery spending still rose 14% year over year to US$40 billion.
Again, price reconciles the apparent contradiction: fewer tonnes can still require more spending.
Technology demand was small but notable
Technology use was 80 tonnes and slightly firmer year over year. The World Gold Council said AI-related demand offset weakness in consumer electronics. That is not evidence that AI infrastructure controls the gold market; technology remained much smaller than the report’s major investment and jewellery categories.
How to use the report without overclaiming
- State whether a number includes OTC activity.
- Separate tonnes from dollar value.
- Name the quarter and comparison period.
- Do not combine ETF flows, bars and coins, central banks, jewellery, and technology into one investor story.
- Treat the Council’s outlook as a scenario, not a promised price path.
- Check the methodology and later revisions before reusing a number.
The report is a structured snapshot of demand and supply through 30 June 2026. It is not a personalized buy signal and it cannot tell a holder whether a particular coin, bar, fund, token, or collectible is fairly priced.
Primary sources
- World Gold Council: Gold Demand Trends Q2 2026
- World Gold Council: historical demand and supply data
Source check: 2 August 2026. Figures may later be revised; use the linked tables for the current series and definitions.
goldGold Demand TrendsQ2 2026hard assetscentral banksgold ETFs